Yeast Plate Growth Analysis Tutorial.
At Stowers we routinely screen for yeast growth defects or rescue using plate growth assays. The images can be generated using a simple flatbed scanner. The plugins for analysis of such images can be downloaded here or as a Fiji update site.
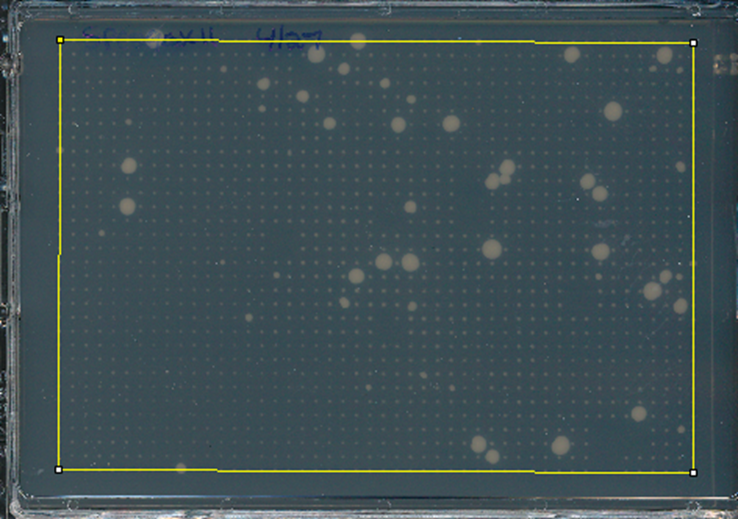
Before starting, you should know the distance between colonies. In my example case, it is 25 pixels, so our analysis radius should be half of that or around 12 pixels. First select the four corner colonies with a polygon in a clockwise fashion starting at the upper left. After completing the polygon you can adjust the corners by dragging them if needed. If you have other plates in the exact same position, you can add the polygon to the roi manager by pressing “t.”
Next run Plugins>Segmentation Tools>plate analysis jru v1. Here is the dialog that shows up:
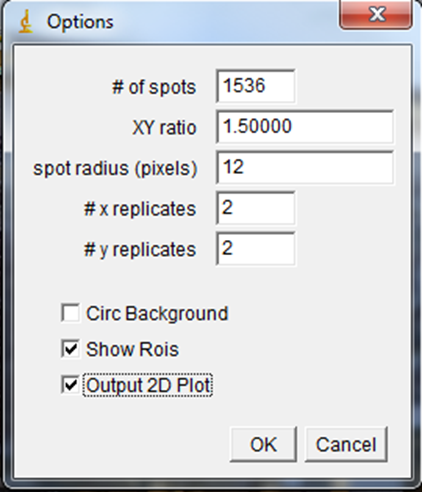
Number of spots and XY ratio describe the geometry of the plate. 1536, 384, and 96 well plates all have an XY ratio of 1.5. Spot radius is the radius over which the analysis will be done. In this case we have four replicates for each strain, so 2 x replicates and 2 y replicates. If you have no replicates, your error matrix table will have NaN values and should be ignored. Circ backround allows the program to use a one pixel ring around each spot for its individual background. This is important if shading isn’t constant around the plate or if slight differences in growth are desired. In our case, we won’t use this option because some of our colonies have grown into their neighbors. In these cases the background will be drastically overestimated. The show rois option puts all of the colony anlaysis regions in the roi manager after running the plugin. The 2D plot option shows a linearized plot of the colony intensities with errors if there are replicates.
After running the plugin, here is a close up of our colonies with the analysis regions drawn:
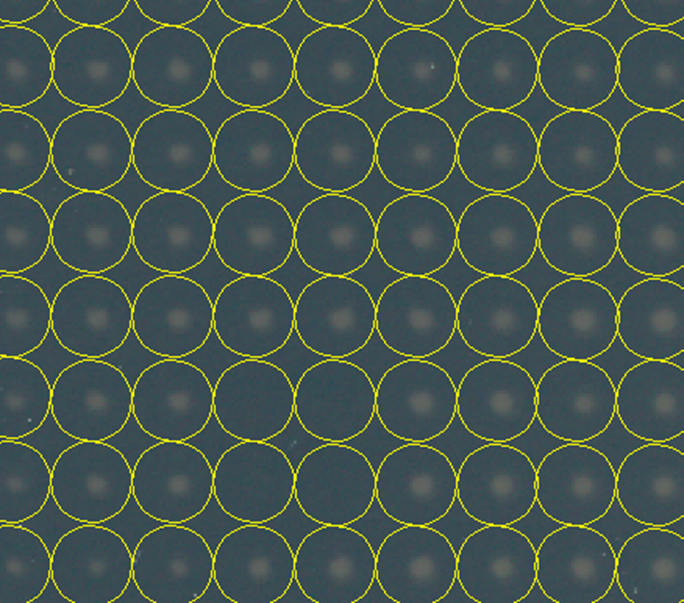
As you can see our colonies are relatively well centered in the analysis regions. Here is our plot of colony densities:
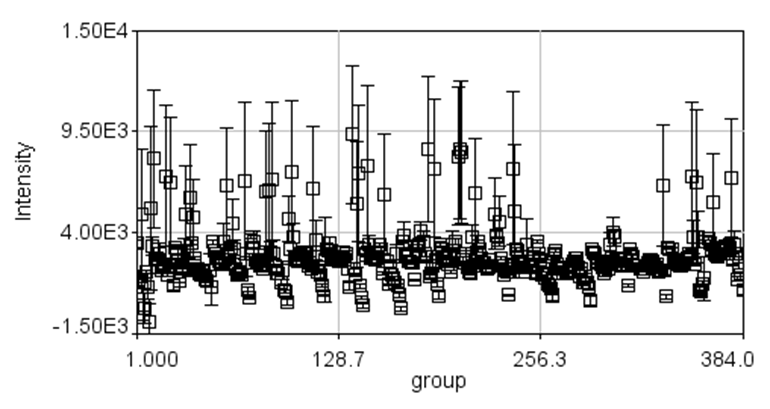
Here we see a few interesting things. Firstly you can see that we have a column bias with colony intensities decreasing as we move across the image. In this case, this appears to be a shading issue given that the right hand side of our plate is darker than elsewhere. If we had selected an earlier time point, we could have used the circ background option and eliminated this. The plugin also outputs the average colony densities and the errors (standard error in the mean) as tables. You can select all and copy to excel. If you want a heat map, you can run Plugins>Table Tools>table2image jru v1 and select the plate densities table. Here is that image for our plate:
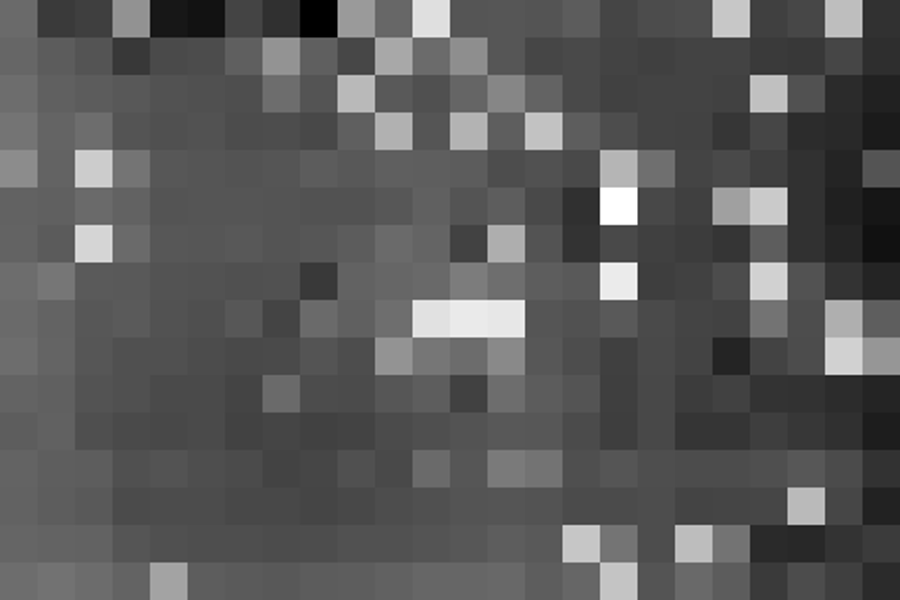
Here you can easily see the shading bias on the right hand side. I like to look at these heatmaps with a blue-green-red color map so that neutral colonies appear green, worse growers appear blue, and better growers appear red. For this, we need a new lookup table (LUT) that isn’t included with ImageJ. You can generate it with Plugins>File Tools>generate jru luts jru v1. You will need to select the desired LUT from the menu and select the ImageJ lut folder for output (on windows this is c:\Program Files\ImageJ\luts). Then restart ImageJ to install it in the Image>Lookup Tables menu. Here is the result:
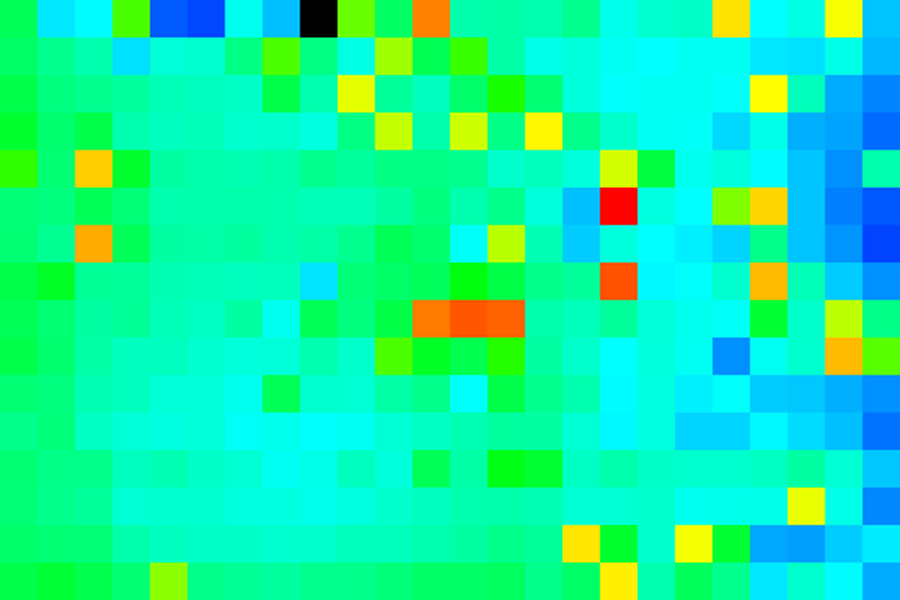
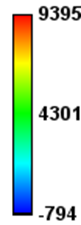
If you want a calibration bar (showing color vs. intensity) use the Image>Color>show LUT or create a much bigger image with the same LUT and select Analyze>Tools>Calibration Bar. If you try to put the calibration bar on our tiny little image it will be far too big. Here is an example:
A note about the method. I use a fairly simplistic method for measuring colony growth: the sum intensity of the colony minus the background (local or image-wide). Many other tools measure the area of the colony. I have chosen not to do this because I don’t find this method to be robust either as an indicator of growth or from an image processing standpoint. One can easily imagine scenarios where small bright colonies would contain more cells than large dim colonies. In those cases the area is a misleading measure of growth. Measuring the boundaries of an object is a difficult task and requires very accurate knowledge of background and noise levels. A spot with slightly higher background and a bit of noise can easily be mistaken for a large colony.